Van Bubbles – Residency
6th sighting in Chatham Strait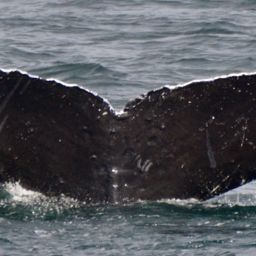
Van Bubbles @16920
Jun 16 – Sep 17, 2019 · Chatham Strait
Chatham Strait · Jun – Sep 2019
139 m
Deepest dive
5:16
Longest dive
129
Dives
- Sightings
- 9
- Days between first and last sighting
- 93
Dive stats modelled within real depth limits — not measured
Get actual dive data with Risa Deep →| Sighting | Seafloor | Sea temp | Deepest dive (modelled) |
|---|---|---|---|
| Jun 16, 2019 | 70 m | 10.6°C | 61 m |
| Jul 24, 2019 | 269 m | 13.6°C | 28 m |
| Jul 31, 2019 | 122 m | 12.1°C | 109 m |
| Aug 1, 2019 | 146 m | 12.9°C | 124 m |
| Aug 15, 2019 | 203 m | 14.1°C | 98 m |
| Aug 27, 2019 | 233 m | 11.8°C | 20 m |
| Sep 15, 2019 | 219 m | 12.1°C | 26 m |
| Sep 16, 2019 | 221 m | 12.3°C | 57 m |
| Sep 17, 2019 | 196 m | 12.1°C | 139 m |
Seafloor and sea temperature measured · ✳ dives modelled

Deepest dive against the seafloor, per sighting
Seafloor · measured Deepest dive · modelledDepth runs down from the surface. The modelled dive never passes the measured seafloor at that sighting.
Dives
139 m
Deepest dive
5:16
Longest dive
129
Dives
27 m
Avg dive depth
9
Sightings
93
Days first → last
Dive metrics are modelled within real depth limits — not measured
Get actual dive data with Risa Deep →Dive profile
modelledDepth shaped by the seafloor limit here (196 m) and the published dive-behaviour distribution. Modelled, not measured.
Deep Effort Score
DeepPlace
Where this happened · Sep 17, 2019
measured- Seafloor depth
- 196 m
- Sea-surface temperature
- 12.1°C
- Distance from shore
- 2.0 km
Across the residency · 9 sightings
measured- Seafloor depth
- 70 m – 269 m
- Sea-surface temperature
- 10.6°C – 14.1°C
- Distance from shore
- 1.0 km – 4.0 km
Sources: GEBCO seafloor grid · NASA JPL MUR sea temperature · PacIOOS coastline distance
Source records
This activity is assembled from 9 catalogued encounters on Happywhale.